学习Udacity无人驾驶工程师课程实现TB3车道线检测功能!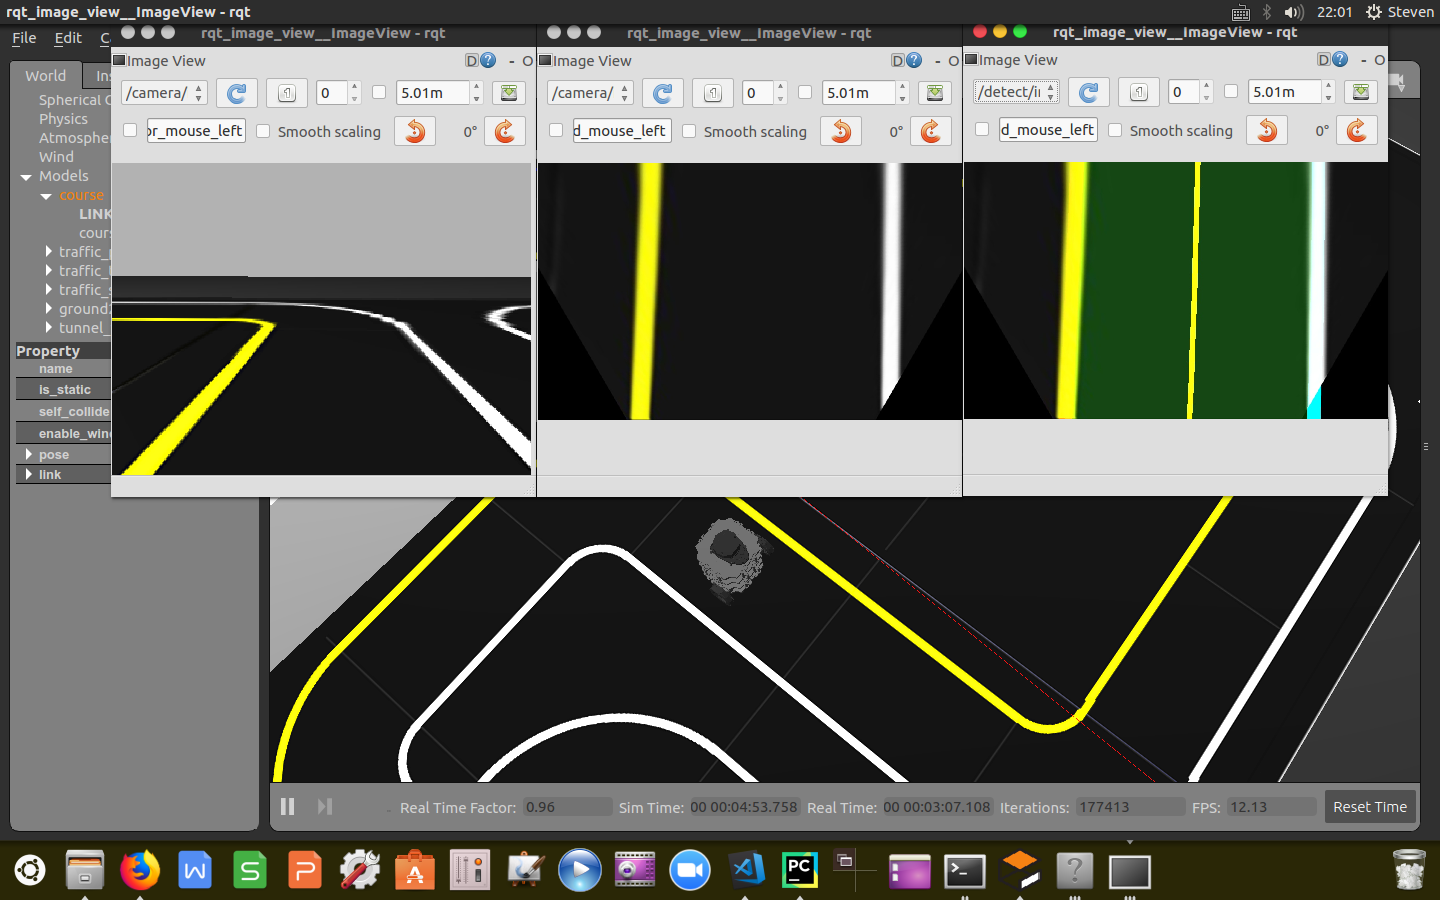
科技本身没有好与坏,AI可以令世界变得更美好
订阅话题
在对我们的车道线进行提取之前先来确定我们需要订阅的话题信息,将树莓派的图像信息进行标定透视处理作为最终的输入图像,可以根据运行电脑的性能来选择订阅原始图像信息还是压缩图像信息。订阅的话题信息如下,这里我们主要订阅原始图像信息/camera/image_projected_compensated,发布压缩图像信息:
1 | self.sub_image_type = "raw" # you can choose image type "compressed", "raw" |
发布话题
发布检测到的车道线信息/detect/yellow(white)_line_reliability以及中心线信息/detect/lane给运动控制器,控制TB3沿固定车道线行驶。
1 | if self.pub_image_type == "compressed": |
设定阈值
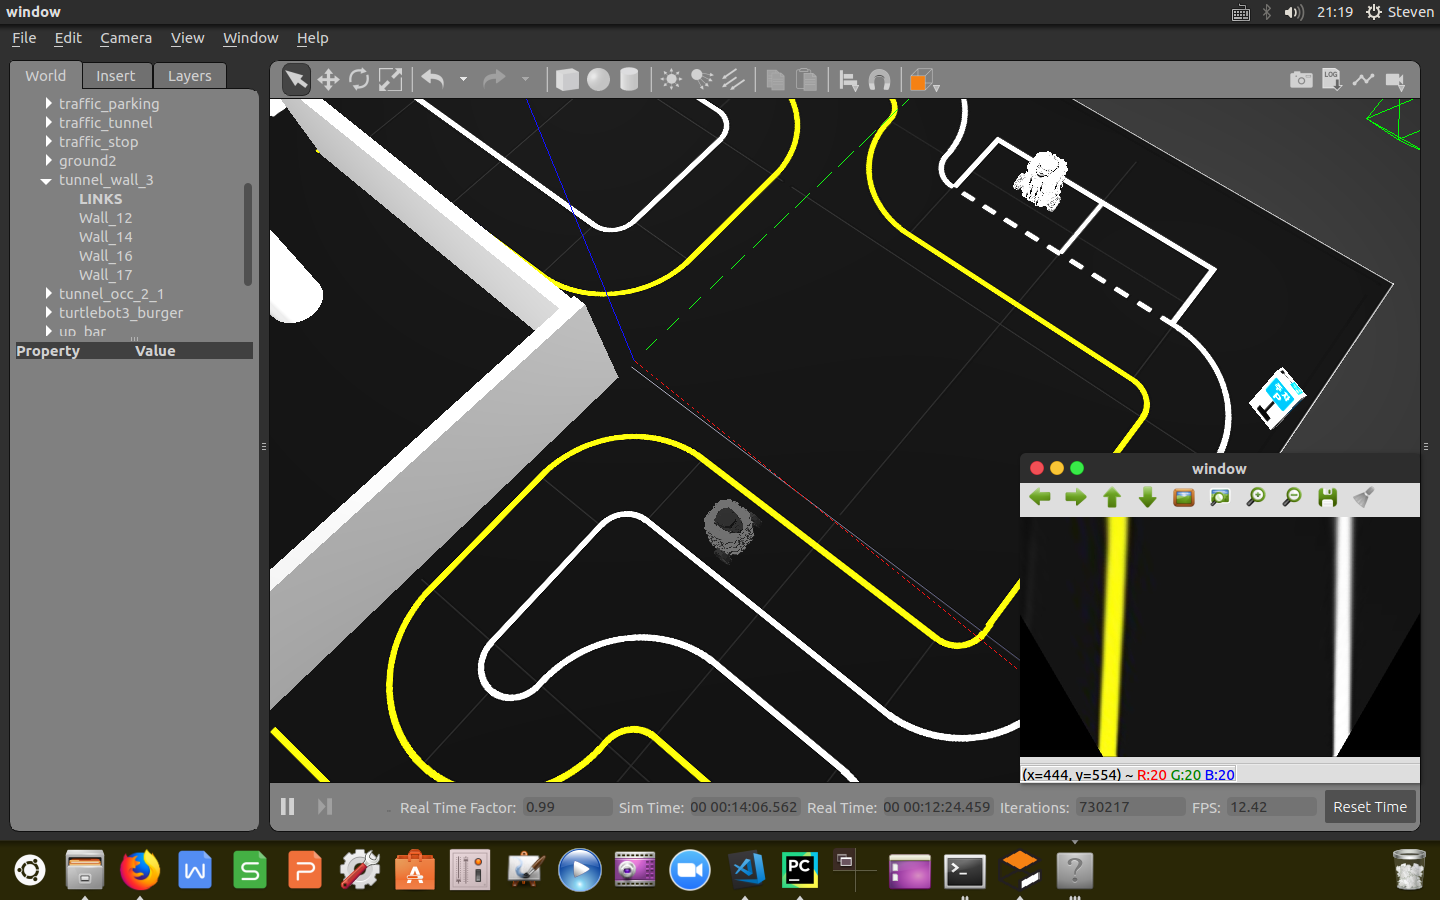
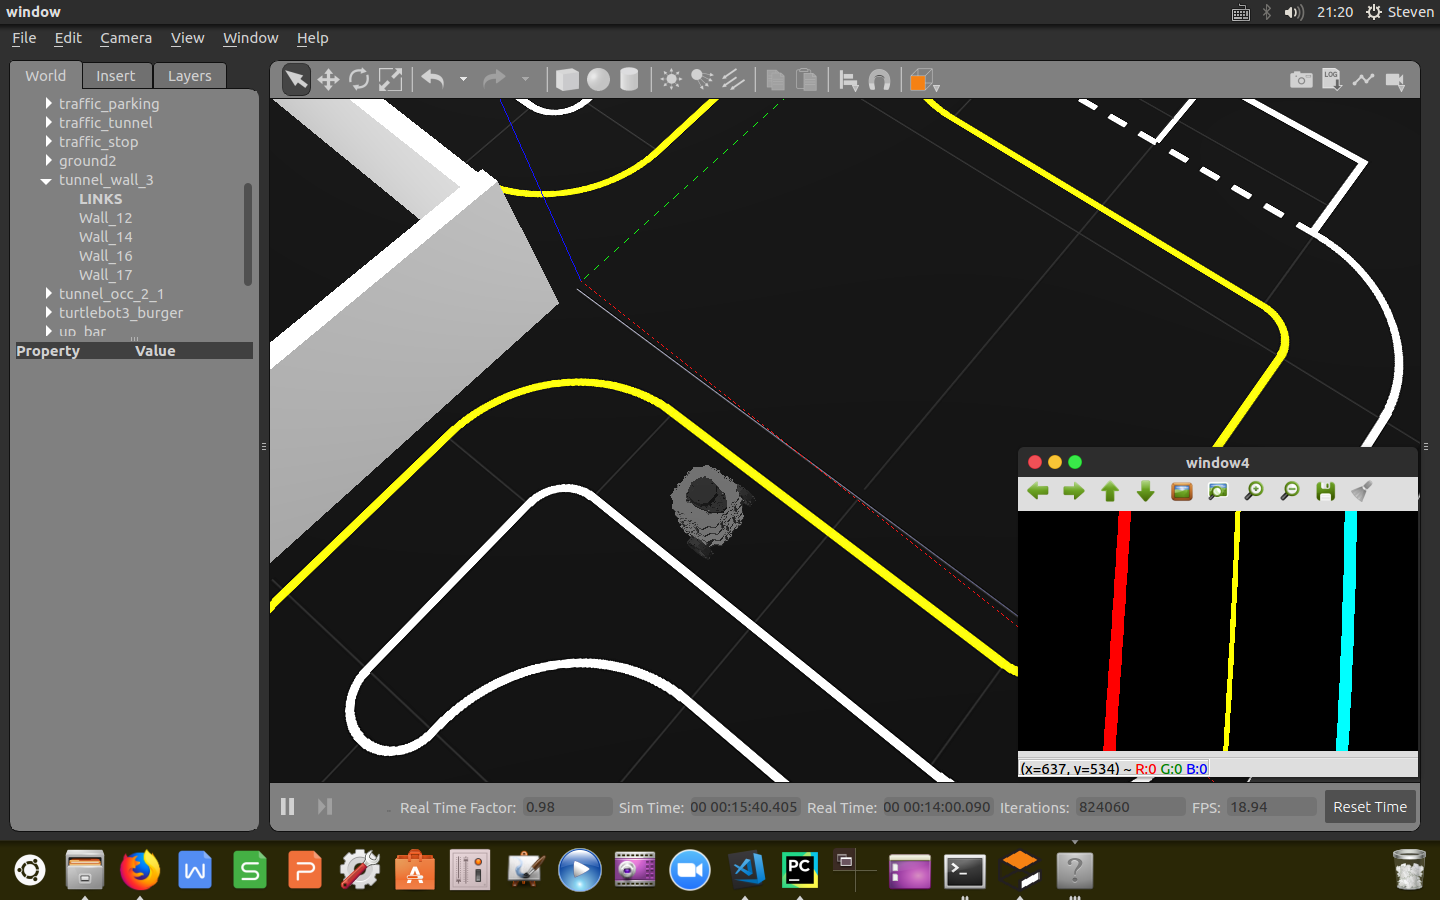
对黄、白车道线设定HSL阈值范围,用以对掩膜后的图像进行车道线提取,可通过将提取的图像打印到屏幕上以便调整阈值范围。1
2
3
4
5
6
7
8
9
10
11
12
13self.hue_white_l = rospy.get_param("~detect/lane/white/hue_l", 0)
self.hue_white_h = rospy.get_param("~detect/lane/white/hue_h", 25)
self.saturation_white_l = rospy.get_param("~detect/lane/white/saturation_l", 0)
self.saturation_white_h = rospy.get_param("~detect/lane/white/saturation_h", 36)
self.lightness_white_l = rospy.get_param("~detect/lane/white/lightness_l", 180)
self.lightness_white_h = rospy.get_param("~detect/lane/white/lightness_h", 255)
self.hue_yellow_l = rospy.get_param("~detect/lane/yellow/hue_l", 27)
self.hue_yellow_h = rospy.get_param("~detect/lane/yellow/hue_h", 41)
self.saturation_yellow_l = rospy.get_param("~detect/lane/yellow/saturation_l", 130)
self.saturation_yellow_h = rospy.get_param("~detect/lane/yellow/saturation_h", 255)
self.lightness_yellow_l = rospy.get_param("~detect/lane/yellow/lightness_l", 160)
self.lightness_yellow_h = rospy.get_param("~detect/lane/yellow/lightness_h", 255)
提取车道线
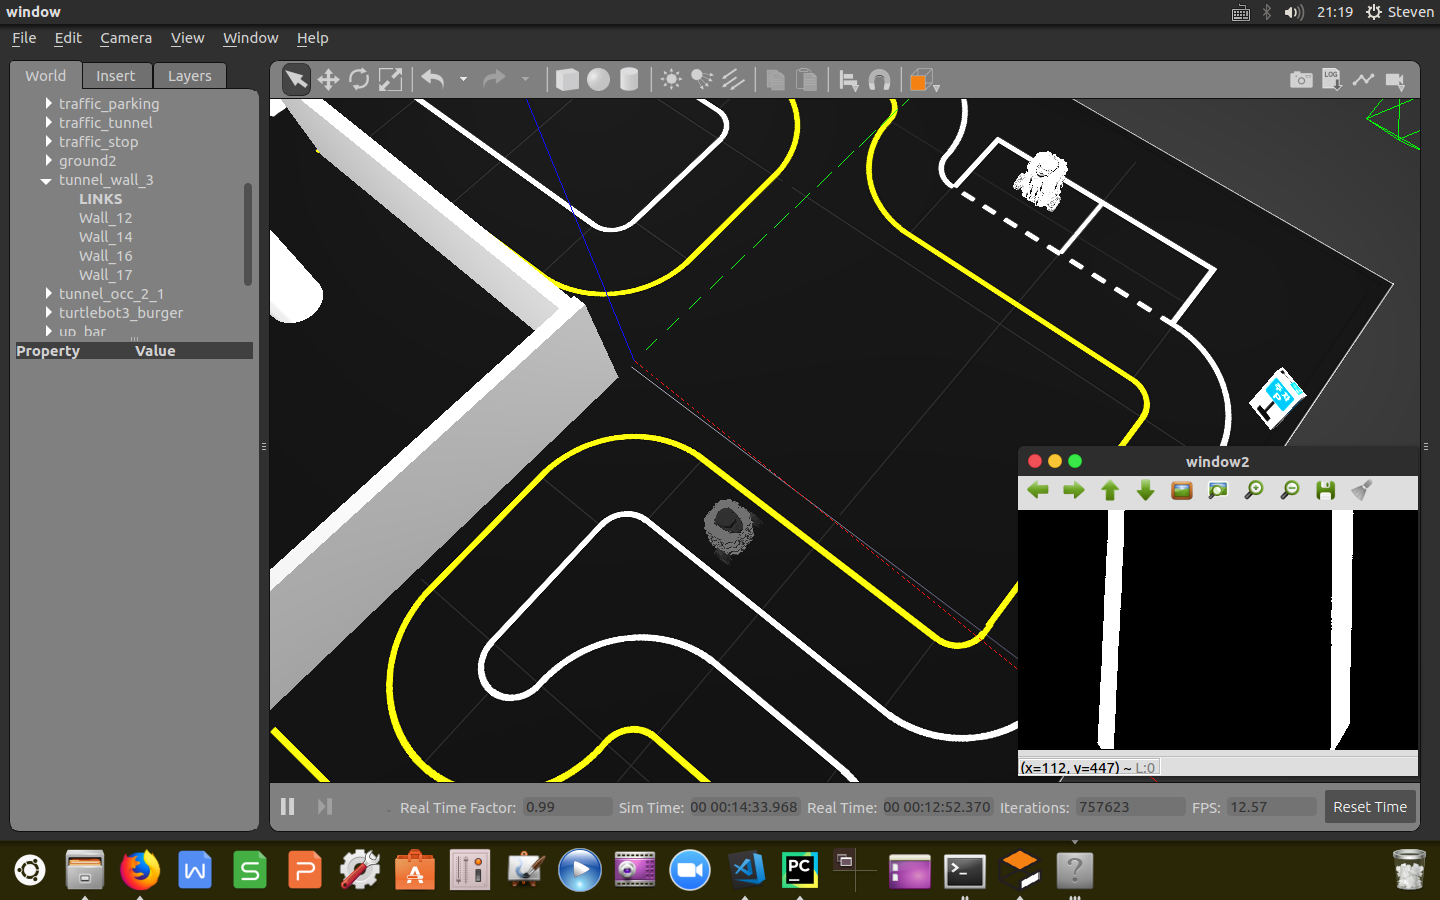
使用OpenCV提供的cv2.cvtColor()接口,将RGB图像转为HSL图像,利用设定的阈值范围掩膜对车道线进行提取,计算出mask图像中的非零像素点的个数fraction_num,根据非零像素点的个数实时调整亮度阈值以达到最佳的提取效果。计算非零像素行的个数,根据非零像素行的个数实时发布提取出的可靠车道线的值,返回非零像素点的个数和提取出的0-1图像,封装代码如下:1
2
3
4
5
6
7
8
9
10
11
12
13
14
15
16
17
18
19
20
21
22
23
24
25
26
27
28
29
30
31
32
33
34
35
36
37
38
39
40
41
42
43
44
45
46
47
48
49
50
51
52
53
54
55def maskWhiteLane(self, image):
# The same to maskYellowLane(self, image)
hsv = cv2.cvtColor(image, cv2.COLOR_BGR2HSV)
Hue_l = self.hue_white_l
Hue_h = self.hue_white_h
Saturation_l = self.saturation_white_l
Saturation_h = self.saturation_white_h
Lightness_l = self.lightness_white_l
Lightness_h = self.lightness_white_h
# define range of white color in HSV
lower_white = np.array([Hue_l, Saturation_l, Lightness_l])
upper_white = np.array([Hue_h, Saturation_h, Lightness_h])
# Threshold the HSV image to get only white colors
mask = cv2.inRange(hsv, lower_white, upper_white)
fraction_num = np.count_nonzero(mask)
if self.is_calibration_mode == False:
if fraction_num > 35000:
if self.lightness_white_l < 250:
self.lightness_white_l += 5
elif fraction_num < 5000:
if self.lightness_white_l > 50:
self.lightness_white_l -= 5
how_much_short = 0
for i in range(0, 600):
if np.count_nonzero(mask[i, ::]) > 0:
how_much_short += 1
how_much_short = 600 - how_much_short
if how_much_short > 100:
if self.reliability_white_line >= 5:
self.reliability_white_line -= 5
elif how_much_short <= 100:
if self.reliability_white_line <= 99:
self.reliability_white_line += 5
msg_white_line_reliability = UInt8()
msg_white_line_reliability.data = self.reliability_white_line
self.pub_white_line_reliability.publish(msg_white_line_reliability)
if self.is_calibration_mode == True:
if self.pub_image_type == "compressed":
self.pub_image_white_lane.publish(self.cvBridge.cv2_to_compressed_imgmsg(mask, "jpg"))
elif self.pub_image_type == "raw":
self.pub_image_white_lane.publish(self.cvBridge.cv2_to_imgmsg(mask, "bgr8"))
return fraction_num, mask
检测车道线
在检测车道线前,需要粗定位车道线的位置。为在有噪点的图像中定位车道线的起始位置,对下半部分图像在每一列上将白色(黄色)像素点个数加和做直方图,取最大值的横坐标作为车道线起始位置,这样我们就粗定位了左右车道线的大致起始位置lane_base。代码如下:1
2
3
4
5
6
7
8
9
10
11
12
13histogram = np.sum(img_w[img_w.shape[0] / 2:, :], axis=0)
# Create an output image to draw on and visualize the result
out_img = np.dstack((img_w, img_w, img_w)) * 255
# Find the peak of the left and right halves of the histogram
# These will be the starting point for the left and right lines
midpoint = np.int(histogram.shape[0] / 2)
if left_or_right == 'left':
lane_base = np.argmax(histogram[:midpoint])
elif left_or_right == 'right':
lane_base = np.argmax(histogram[midpoint:]) + midpoint
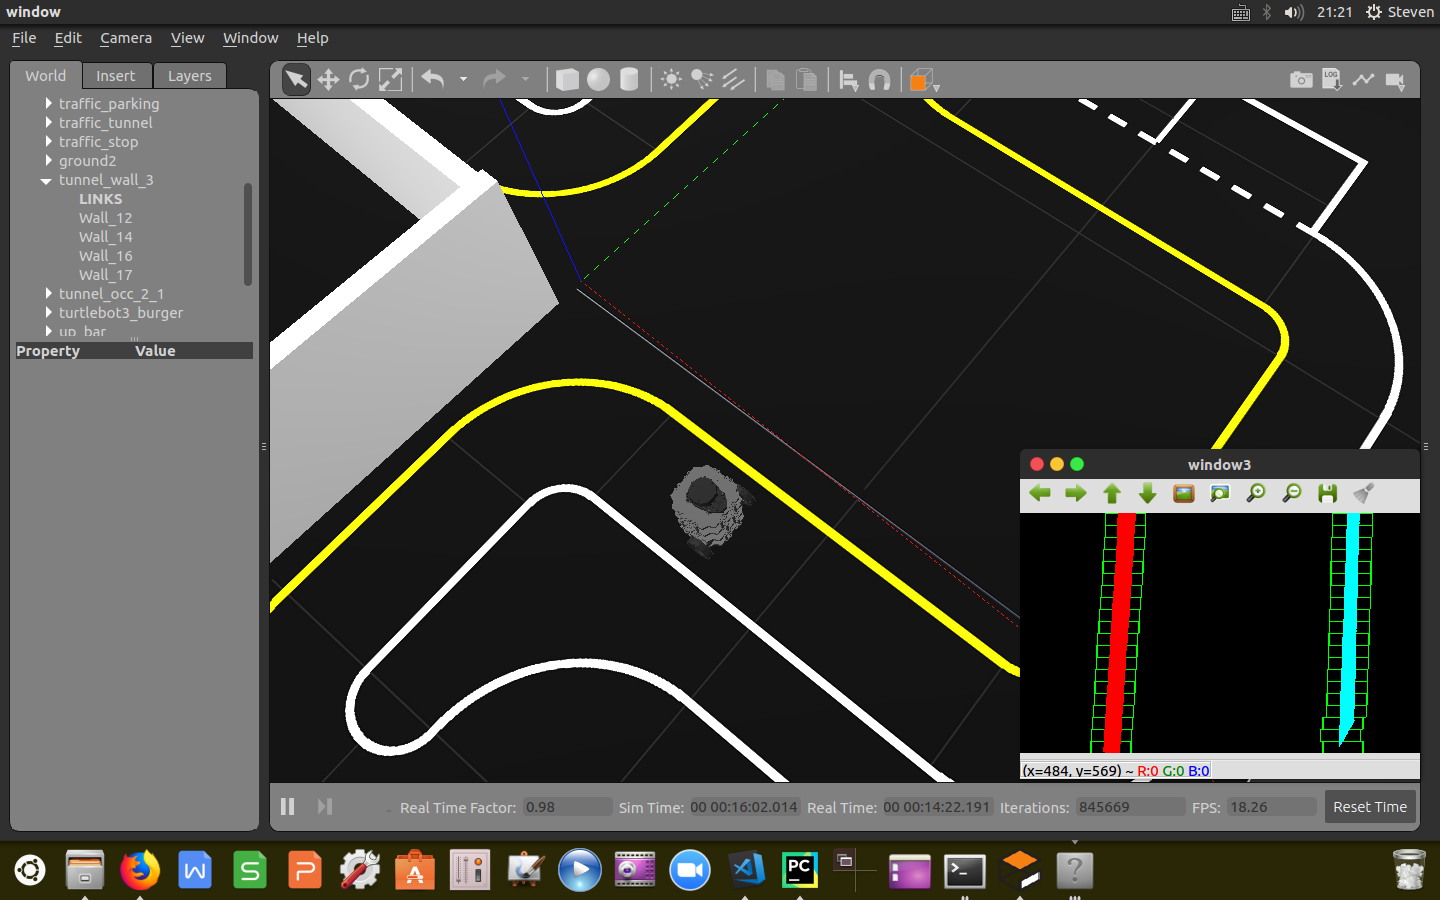
确定了左右车道线的大致位置后,利用“滑动窗口”的技术对图中左右车道线的像素点进行搜索,提取出去噪之后的车道线。
设定滑窗个数,计算滑窗高度,设定范围margin值进而计算出滑窗的边界坐标。存储滑窗中像素点的横坐标索引,如果滑窗中的像素点超过设定的最小值,取滑窗中像素点的均值更新下一个滑窗的中心位置,以此往复,直到把所有行都搜索完。将存储的索引值转化成OpenCV格式,提取像素线的位置坐标,利用二次多项式进行拟合,生成系数值(lane_fit)以及二次多项式(lane_fitx)返回二次多项式和系数值。封装代码如下:1
2
3
4
5
6
7
8
9
10
11
12
13
14
15
16
17
18
19
20
21
22
23
24
25
26
27
28
29
30
31
32
33
34
35
36
37
38
39
40
41
42
43
44
45
46
47
48
49
50
51
52
53
54
55
56
57
58
59
60
61
62
63
64
65
66
67
68
69
70
71
72
73
74
75def sliding_windown(self, img_w, left_or_right):
histogram = np.sum(img_w[img_w.shape[0] / 2:, :], axis=0)

       # Create an output image to draw on and visualize the result
       out_img = np.dstack((img_w, img_w, img_w)) * 255

       # Find the peak of the left and right halves of the histogram
       # These will be the starting point for the left and right lines
       midpoint = np.int(histogram.shape[0] / 2)

       if left_or_right == 'left':
           lane_base = np.argmax(histogram[:midpoint])
       elif left_or_right == 'right':
           lane_base = np.argmax(histogram[midpoint:]) + midpoint
# Choose the number of sliding windows
nwindows = 20
# Set height of windows
window_height = np.int(img_w.shape[0] / nwindows)
# Identify the x and y positions of all nonzero pixels in the image
nonzero = img_w.nonzero()
nonzeroy = np.array(nonzero[0])
nonzerox = np.array(nonzero[1])
# Current positions to be updated for each window
x_current = lane_base
# Set the width of the windows +/- margin
margin = 50
# Set minimum number of pixels found to recenter window
minpix = 50
# Create empty lists to receive lane pixel indices
lane_inds = []
# Step through the windows one by one
for window in range(nwindows):
# Identify window boundaries in x and y
win_y_low = img_w.shape[0] - (window + 1) * window_height
win_y_high = img_w.shape[0] - window * window_height
win_x_low = x_current - margin
win_x_high = x_current + margin
# Draw the windows on the visualization image
cv2.rectangle(out_img, (win_x_low, win_y_low), (win_x_high, win_y_high), (0, 255, 0), 2)
# Identify the nonzero pixels in x and y within the window
good_lane_inds = ((nonzeroy >= win_y_low) & (nonzeroy < win_y_high) & (nonzerox >= win_x_low) & (
nonzerox < win_x_high)).nonzero()[0]
# Append these indices to the lists
lane_inds.append(good_lane_inds)
# If you found > minpix pixels, recenter next window on their mean position
if len(good_lane_inds) > minpix:
x_current = np.int(np.mean(nonzerox[good_lane_inds]))
# Concatenate the arrays of indices
lane_inds = np.concatenate(lane_inds)
# Extract line pixel positions
x = nonzerox[lane_inds]
y = nonzeroy[lane_inds]
# Fit a second order polynomial to each
try:
lane_fit = np.polyfit(y, x, 2)
self.lane_fit_bef = lane_fit
except:
lane_fit = self.lane_fit_bef
# Generate x and y values for plotting
ploty = np.linspace(0, img_w.shape[0] - 1, img_w.shape[0])
lane_fitx = lane_fit[0] * ploty ** 2 + lane_fit[1] * ploty + lane_fit[2]
return lane_fitx, lane_fit
跟踪车道线
实时图像信息是连续的图片,基于连续两帧图像中的车道线不会突变的先验知识,我们可以使用上一帧检测到的车道线结果,横向扩展一定区域作为下一帧图像处理的输入,搜索上一帧车道线检测结果附近的点,这样不仅可以减少计算量,而且得到的车道线结果也更稳定。输入:滑窗帧的系数值,车道线的0-1图像,输出:二次多项式和系数值。封装代码如下:1
2
3
4
5
6
7
8
9
10
11
12
13
14
15
16
17
18
19
20
21def fit_from_lines(self, lane_fit, image):
nonzero = image.nonzero()
nonzeroy = np.array(nonzero[0])
nonzerox = np.array(nonzero[1])
margin = 100
lane_inds = ((nonzerox > (lane_fit[0] * (nonzeroy ** 2) + lane_fit[1] * nonzeroy + lane_fit[2] - margin)) & (
nonzerox < (lane_fit[0] * (nonzeroy ** 2) + lane_fit[1] * nonzeroy + lane_fit[2] + margin)))
# Again, extract line pixel positions
x = nonzerox[lane_inds]
y = nonzeroy[lane_inds]
# Fit a second order polynomial to each
lane_fit = np.polyfit(y, x, 2)
# Generate x and y values for plotting
ploty = np.linspace(0, image.shape[0] - 1, image.shape[0])
lane_fitx = lane_fit[0] * ploty ** 2 + lane_fit[1] * ploty + lane_fit[2]
return lane_fitx, lane_fit
提取中心线
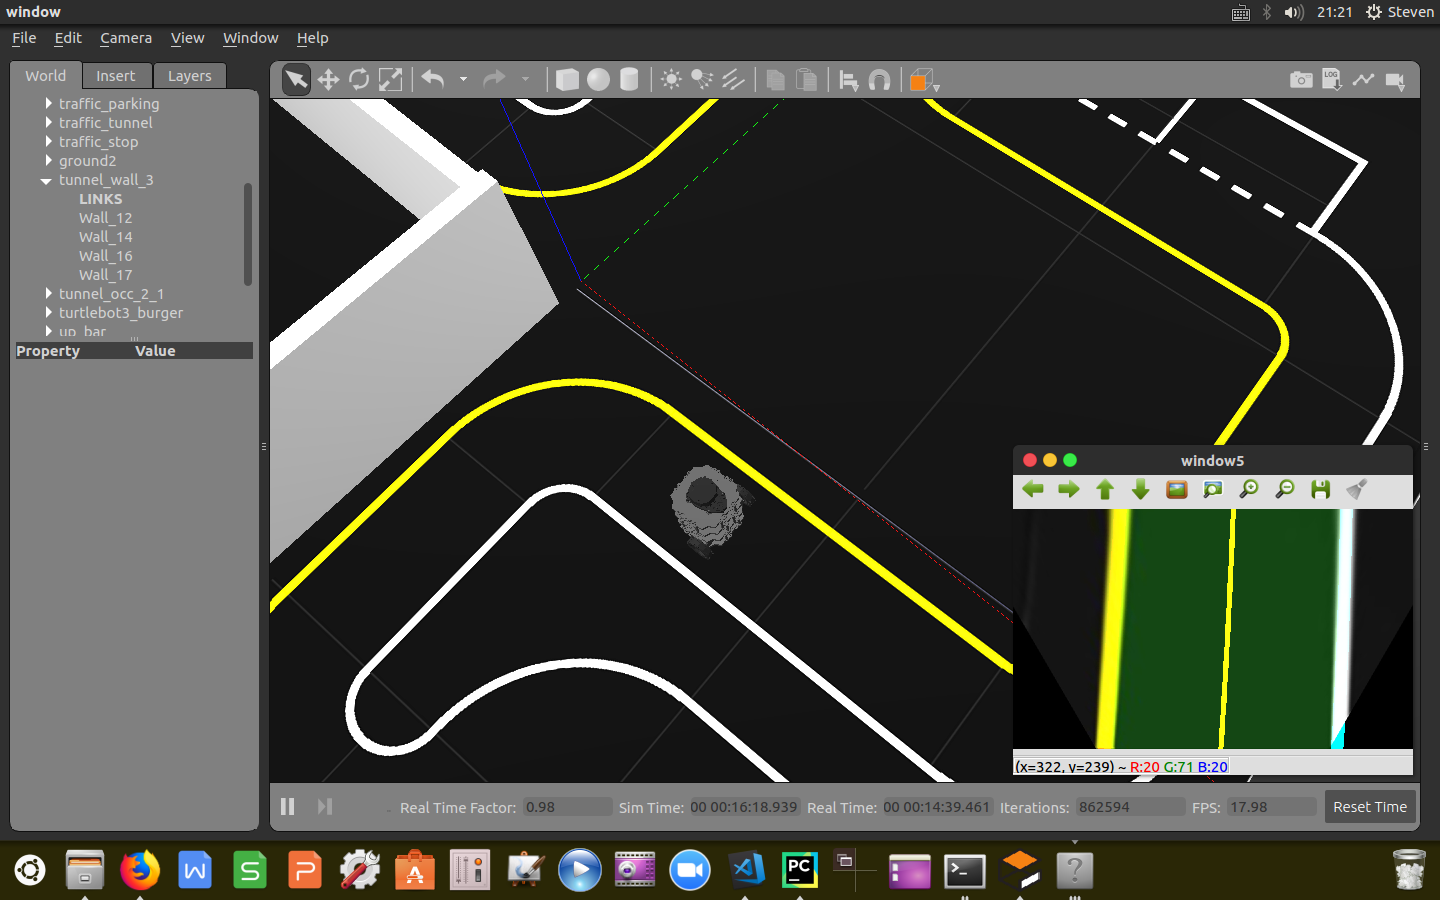
在左右车道线提取完成后,需要检测的车道线被凸显出来了。利用numpy库将左右车道线二次多项式的横坐标转换成OpenCV格式,求出点对绘制出左右车道线。将左右车道线像素点横坐标取均值求出中点横坐标,根据输入的左右车道线的像素点检测情况实时调整中点横坐标。利用“截取”的方式提取我们的感兴趣区域(Region of Interest),根据提取出的车道线像素点坐标对绘制封闭多边形标识ROI区域。将中心线和ROI区域叠加到原图上,输出final图像和中心线横坐标。封装代码如下:1
2
3
4
5
6
7
8
9
10
11
12
13
14
15
16
17
18
19
20
21
22
23
24
25
26
27
28
29
30
31
32
33
34
35
36
37
38
39
40
41
42
43
44
45
46
47
48
49
50
51
52
53
54
55
56
57
58
59
60
61
62
63
64
65
66
67
68
69
70
71
72
73
74
75
76
77
78
79
80
81
82
83def make_lane(self, cv_image, white_fraction, yellow_fraction):
# Create an image to draw the lines on
warp_zero = np.zeros((cv_image.shape[0], cv_image.shape[1], 1), dtype=np.uint8)
color_warp = np.dstack((warp_zero, warp_zero, warp_zero))
color_warp_lines = np.dstack((warp_zero, warp_zero, warp_zero))
ploty = np.linspace(0, cv_image.shape[0] - 1, cv_image.shape[0])
if yellow_fraction > 3000:
pts_left = np.array([np.flipud(np.transpose(np.vstack([self.left_fitx, ploty])))])
cv2.polylines(color_warp_lines, np.int_([pts_left]), isClosed=False, color=(0, 0, 255), thickness=25)
if white_fraction > 3000:
pts_right = np.array([np.transpose(np.vstack([self.right_fitx, ploty]))])
cv2.polylines(color_warp_lines, np.int_([pts_right]), isClosed=False, color=(255, 255, 0), thickness=25)
self.is_center_x_exist = True
if self.reliability_white_line > 50 and self.reliability_yellow_line > 50:
if white_fraction > 3000 and yellow_fraction > 3000:
centerx = np.mean([self.left_fitx, self.right_fitx], axis=0)
pts = np.hstack((pts_left, pts_right))
pts_center = np.array([np.transpose(np.vstack([centerx, ploty]))])
cv2.polylines(color_warp_lines, np.int_([pts_center]), isClosed=False, color=(0, 255, 255),
thickness=12)
# Draw the lane onto the warped blank image
cv2.fillPoly(color_warp, np.int_([pts]), (0, 255, 0))
if white_fraction > 3000 and yellow_fraction <= 3000:
centerx = np.subtract(self.right_fitx, 320)
pts_center = np.array([np.transpose(np.vstack([centerx, ploty]))])
cv2.polylines(color_warp_lines, np.int_([pts_center]), isClosed=False, color=(0, 255, 255),
thickness=12)
if white_fraction <= 3000 and yellow_fraction > 3000:
centerx = np.add(self.left_fitx, 320)
pts_center = np.array([np.transpose(np.vstack([centerx, ploty]))])
cv2.polylines(color_warp_lines, np.int_([pts_center]), isClosed=False, color=(0, 255, 255),
thickness=12)
elif self.reliability_white_line <= 50 and self.reliability_yellow_line > 50:
centerx = np.add(self.left_fitx, 320)
pts_center = np.array([np.transpose(np.vstack([centerx, ploty]))])
cv2.polylines(color_warp_lines, np.int_([pts_center]), isClosed=False, color=(0, 255, 255), thickness=12)
elif self.reliability_white_line > 50 and self.reliability_yellow_line <= 50:
centerx = np.subtract(self.right_fitx, 320)
pts_center = np.array([np.transpose(np.vstack([centerx, ploty]))])
cv2.polylines(color_warp_lines, np.int_([pts_center]), isClosed=False, color=(0, 255, 255), thickness=12)
else:
self.is_center_x_exist = False
# TODO: stop
pass
# Combine the result with the original image
final = cv2.addWeighted(cv_image, 1, color_warp, 0.2, 0)
final = cv2.addWeighted(final, 1, color_warp_lines, 1, 0)
if self.pub_image_type == "compressed":
if self.is_center_x_exist == True:
# publishes lane center
msg_desired_center = Float64()
msg_desired_center.data = centerx.item(350)
self.pub_lane.publish(msg_desired_center)
self.pub_image_lane.publish(self.cvBridge.cv2_to_compressed_imgmsg(final, "jpg"))
elif self.pub_image_type == "raw":
if self.is_center_x_exist == True:
# publishes lane center
msg_desired_center = Float64()
msg_desired_center.data = centerx.item(350)
self.pub_lane.publish(msg_desired_center)
self.pub_image_lane.publish(self.cvBridge.cv2_to_imgmsg(final, "bgr8"))
至此,已完成所有车道线提取工作。
经验分享
1.本算法是根据实车的车道线检测教程移植到TB3小车上,需要注意ROS编程中的话题订阅和发布格式。
2.在编写检测代码的过程中,每一步都要调整很多参数,才能满足后续的实验需求,需要结合真实环境下的实验场地针对性的调整参数。
3.本算法已在仿真环境下验证,但是并能代表应用于所有环境,面对变化更为恶劣的真实场景时,还是无能为力,鲁棒性差。
4.在对车道线提取过程中利用了颜色阈值方法,还可以采用梯度阈值的方法,为了应对多变的路面情况,需要结合多种阈值过滤方法。
5.现阶段多采用深度学习的方法增强检测算法的鲁棒性,拿足够多的标注数据去训练模型,才能尽可能多地达到稳定的检测效果。
附
完整程序源代码:https://github.com/sun-coke/TB3_Autorace
参考文献
https://github.com/udacity/CarND-Advanced-Lane-Lines
https://github.com/yang1688899/CarND-Advanced-Lane-Lines
https://cn.udacity.com/course/self-driving-car-fundamentals-featuring-apollo